DCCF Conversion
The following sections describe the source, method, and example of DCCF conversion.
Basis and Source
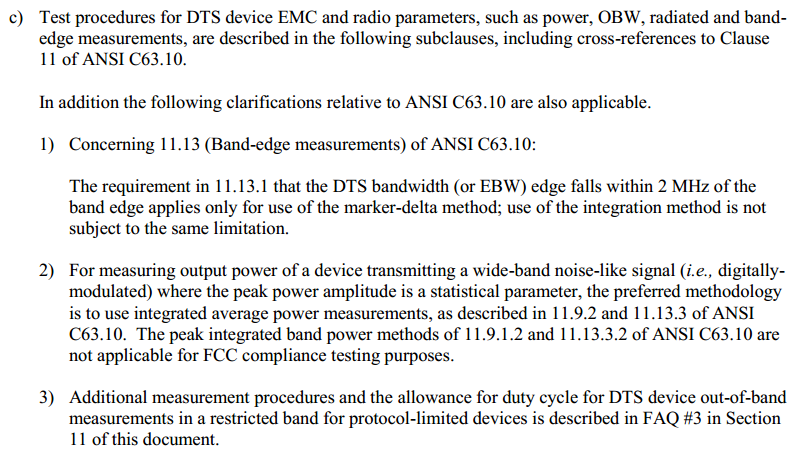
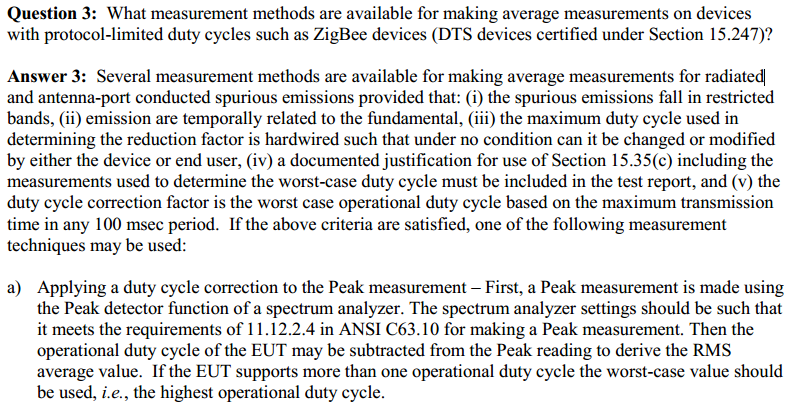
The official FCC document KDB558074 "Guidance for Compliance Measurements on Digital Transmission System, Frequency Hopping Spread Spectrum System, and Hybrid System Devices Operating under Section 15.247 of the FCC Rules" clearly states that DTS device can use DCCF conversion to obtain RSE results.
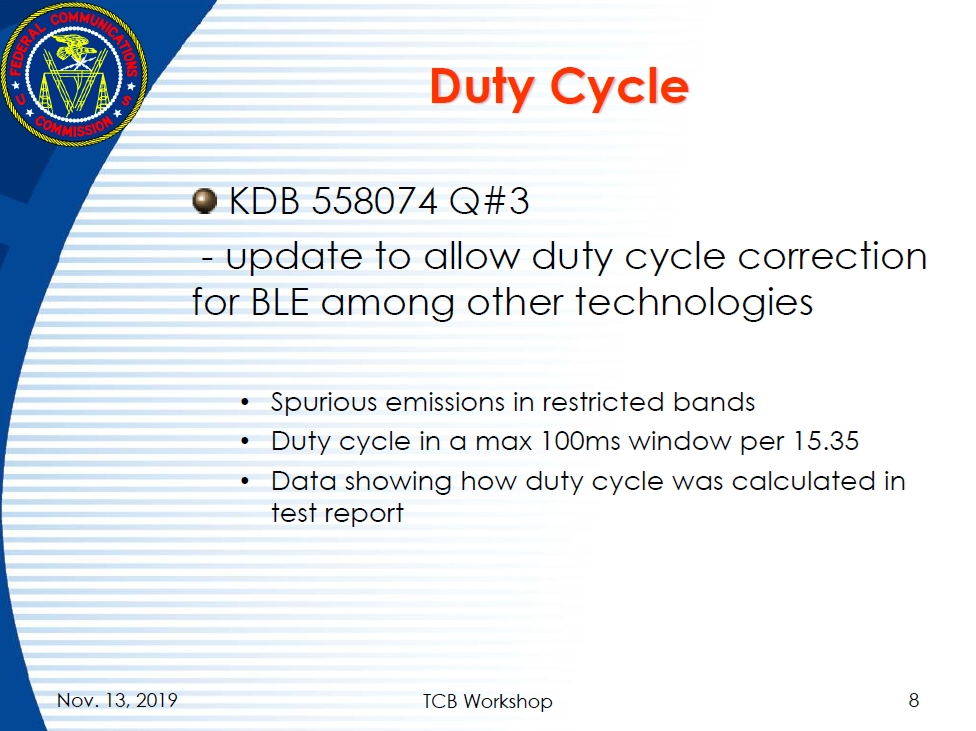
In November 2019, Telecommunication Certification Body (TCB) Council held a workshop where it further explained the DCCF applicability among DTS devices. It is an update to Q#3 in KDB558074.
Conversion Method
For DCCF calculation formula, refer to Section 7.5 of ANSI C63.10-2020 American National Standard of Procedures for Compliance Testing of Unlicensed Wireless Devices or the calculation instructions in test report sample from "Certification Notes".
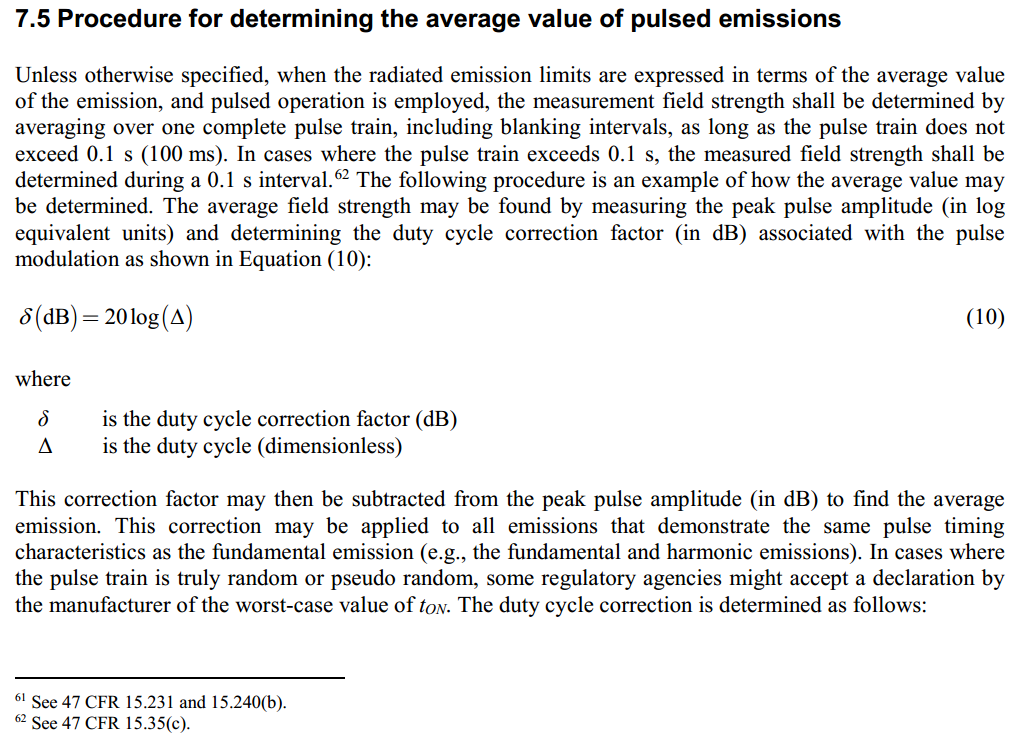
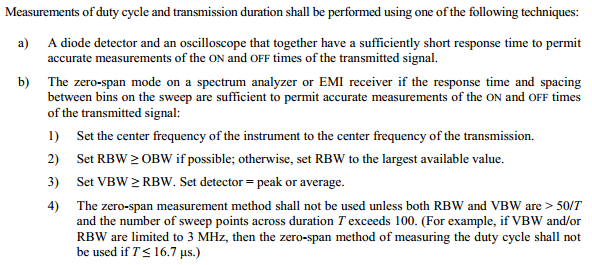
For duty cycle (△) description and instrument settings, please refer to Section 11.6 of ANSI C63.10-2020 American National Standard of Procedures for Compliance Testing of Unlicensed Wireless Devices, as shown in the figure below.
Measurement Example
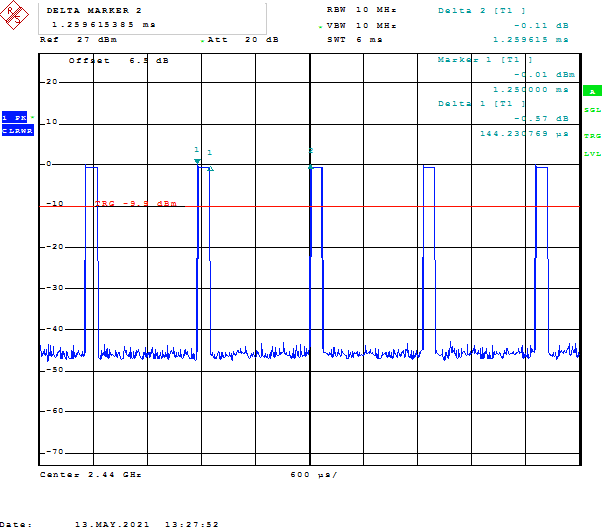
Suppose that in a certain FCC certification test, Ton = 144.23 μs = 0.144 ms, Tp = 1.26 ms, then Duty Cycle Value = 11.43% is calculated according to the formula: Duty Cycle Value = Ton/Tp. The test diagram for transmitted duty cycle value is shown below.
Then the FCC RSE average value is computed as follows.
- Measure the RSE MaxPeak values directly.
Table 1 Peak value reference Frequency (MHz) MaxPeak (dBµV/m) Limit (dBµV/m) Margin (dB) Height (cm) Pol Azimuth (deg) Corr. (dB) 1440.300000 42.18 74.00 31.82 200.0 H 265.0 1.2 4802.900000 49.67 74.00 24.33 200.0 H 151.0 11.8 7206.700000 60.08 74.00 13.92 150.0 H 44.0 15.3 12010.900000 67.71 74.00 6.29 150.0 H 36.0 21.1 16813.400000 59.62 74.00 14.38 150.0 H 226.0 24.5 17646.400000 56.79 74.00 17.21 150.0 H 113.0 29.2 - Calculate DCCF: DCCF =20 * log(Ton/Tp) = 20 * log (0.144/1.26) = -18.84 dB
- Calculate average value: Average value = Peak value + DCCF
- The average values obtained through conversion are shown below, obtained by subtracting 18.84 dB from the MaxPeak values presented in the table above.
Table 2 Average value reference Frequency (MHz) Average (dBµV/m) Limit (dBµV/m) Margin (dB) Height (cm) Pol Azimuth (deg) Corr. (dB) 1440.300000 23.34 54.00 30.66 200.0 H 265.0 1.2 4802.900000 30.83 54.00 23.17 200.0 H 151.0 11.8 7206.700000 41.24 54.00 12.76 150.0 H 44.0 15.3 12010.900000 48.87 54.00 5.13 150.0 H 36.0 21.1 16813.400000 40.78 54.00 13.22 150.0 H 226.0 24.5 17646.400000 37.95 54.00 16.05 150.0 H 113.0 29.2