Configure the Debugger
Configure the debugger before debugging. Click ![]() (Options for Target) on the Keil toolbar to open the Options for Target ‘GR551x_SK’ dialog box, and then select Debug tab. In the window, software simulation debugging displays on the left, and online hardware debugging displays on the right. Bluetooth LE example projects adopt the online hardware debugging. Related default configurations of the debugger are shown as follows:
(Options for Target) on the Keil toolbar to open the Options for Target ‘GR551x_SK’ dialog box, and then select Debug tab. In the window, software simulation debugging displays on the left, and online hardware debugging displays on the right. Bluetooth LE example projects adopt the online hardware debugging. Related default configurations of the debugger are shown as follows:
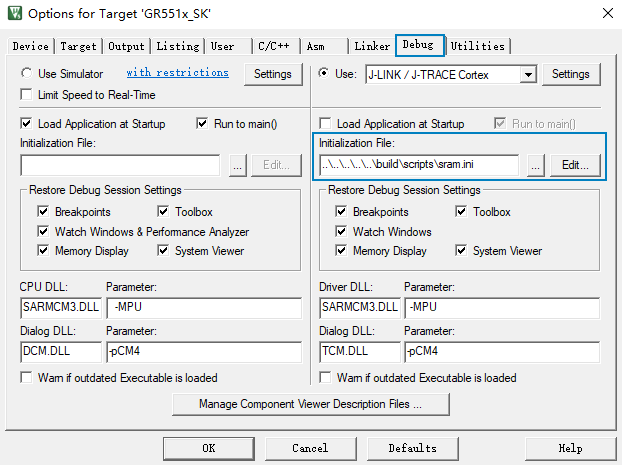
The default initialization file sram.ini is in SDK_Folder\build\scripts. You can use this file directly, or copy it to the project directory.
SDK_Folder is the root directory of GR551x SDK.
The initialization file sram.ini contains a set of debug commands, which are executed during debugging. On the Initialization File bar, click Edit... on the right side, to open the sram.ini file. Example code of sram.ini is provided as follows:
/**
*****************************************************************
* GR551x object loading script through debugger interface
* (e.g.Jlink, *etc).
* The goal of this script is to load the Keils's object file to the
* GR551x RAM
* assuring that the GR551x has been previously cleaned up.
*****************************************************************
*/
// Debugger reset(check Keil debugger settings)
// Preselected reset type(found in Options->Debug->Settings)is
// Normal(0);
// -Normal:Reset core & peripherals via SYSRESETREQ & VECTRESET bit
// RESET
// Load object file
LOAD %L
// Load stack pointer
SP = _RDWORD(0x00000000)
// Load program counter
$ = _RDWORD(0x00000004)
// Write 0 to vector table register, remap vector
_WDWORD(0xE000ED08, 0x00000000) Keil supports executing debugger commands set by developers in the following order:
- When Load Application at Startup () is enabled, the debugger first loads the file under Name of Executable ().
- Execute the command in the file specified in .
- When options under are checked, restore corresponding Breakpoints, Watch Windows, Memory Display, and other settings.
- When is checked, or the command g,main is discovered in the Initialization File, the debugger automatically starts executing CPU commands, until running to the main() function.